In this post, I would like to summarize the steps to set up debugging of Raspberry Pi Pico with Picoprobe in VS Code on Windows. Most of this post is taken from other tutorials. See the references at the bottom of this page.
I presume that you’re already familiar with using Visual Studio Code on Windows 10 to compile your code into a UF2 file for deployment. Instead of cluttering this guide with redundant information, I recommend referring to either Shabaz’s guide or the official documentation to reach this stage.
Picoprobe
Setting up the hardware
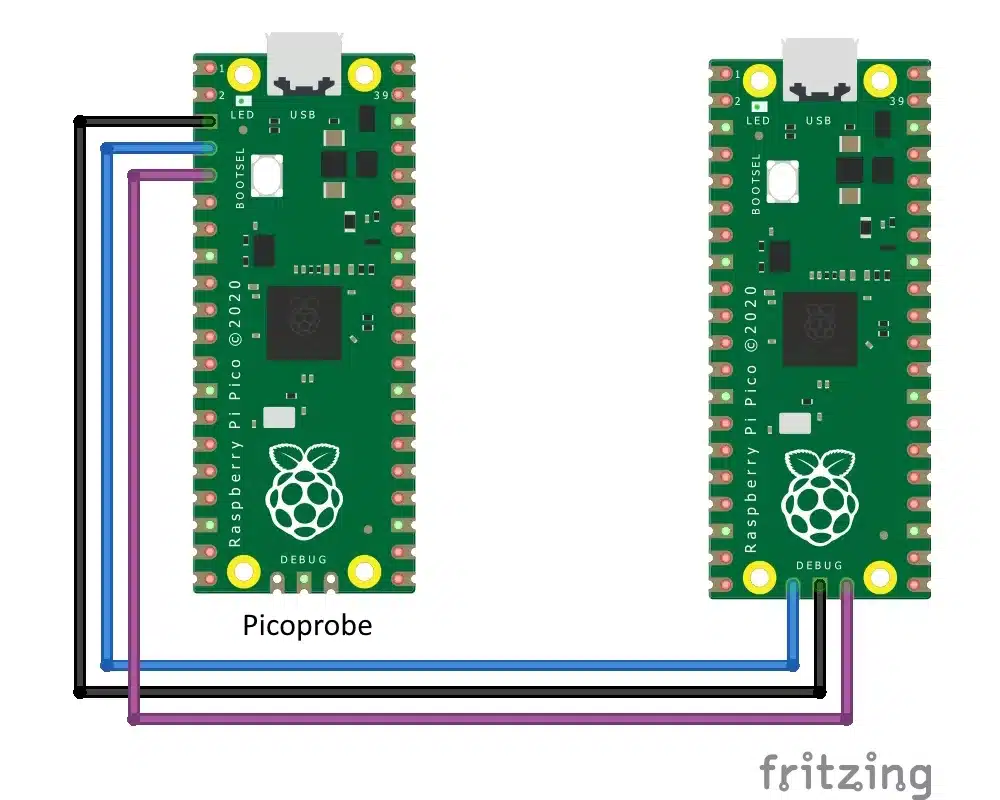
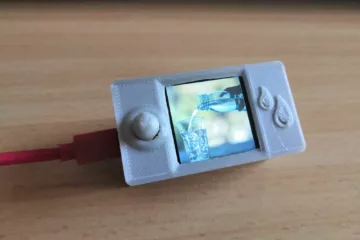
All you need to do is grab the picoprobe.uf2 file from here and flash it to a second Pico. The official guide shows the debugger and target wired up on a breadboard and providing power from pads 38 and 39, but I found that using pads 3 (GND), 4 (SCK), and 5 (SDIO) was more convenient, and I powered the target device independently. Here’s a picture of my picoprobe wired up to another Pico.
Picoprobe Interfaces
The Picoprobe device is a composite device that has two USB interfaces:
- A class-compliant CDC UART (serial port), which means it works on Windows out of the box
- A vendor-specific interface for SWD probe data conforming to CMSIS-DAP v2. ( Previous picoprobe firmware versions required manual installation of libusb-win32 for the vendor-specific interface. This is no longer necessary, as WinUSB is automatically assigned to the debug interface.)
OpenOCD and GDB
OpenOCD
The two tools needed to debug C or C++ code on the Pico are OpenOCD and GDB. These are essentially command-line tools, so we need to get these running happily from the command line before we try to configure Visual Studio Code to use them and provide us with a more usable GUI. The official guide describes pulling down a Raspberry Pi-provided OpenOCD repo and building OpenOCD from source with the necessary options to use it with the Pico’s RP2040 microcontroller and the Picoprobe. I will repeat the instructions below:
To make building OpenOCD as easy as possible, we will use MSYS2. To quote their website: “MSYS2 is a collection of tools and libraries providing you with an easy-to-use environment for building, installing, and running native Windows software.”
Download and run the installer from https://www.msys2.org/.
Start by updating the package database and core system packages with:
$ pacman -SyuIf MSYS2 closes, start it again (making sure you select the 64-bit version: MSYS2 MINGW64) and run
$ pacman -Suto finish the update.
Install required dependencies:
$ pacman -S mingw-w64-x86_64-toolchain git make libtool pkg-config autoconf automake texinfo mingw-w64-x86_64-libusbPick all when installing the mingw-w64-x86_64 toolchain by pressing enter.

Close MSYS2 and reopen the 64-bit version to ensure the environment picks up GCC (run gcc –version).
Clone the OpenOCD repository from GitHub and build it in your preferred location:
$ cd /f/PICO/
$ git clone https://github.com/raspberrypi/openocd.git --branch rp2040 --depth=1
$ cd openocd
$ ./bootstrap
$ ./configure --disable-werror
$ make -j4
(Unfortunately, disable-werror is needed because not everything compiles cleanly on Windows)
When OpenOCD is done building, you must copy the libusb-1.0.dll library file from your MSYS2 directory. This .dll file must be in the same directory as your openocd.exe file for the tool to work. If you move openocd.exe, you must copy libusb-1.0.dll to the same folder.
Enter the following command to copy the file into the current directory:
$ cp /c/msys64/mingw64/bin/libusb-1.0.dll src/libusb-1.0.dllFinally, run OpenOCD to check it has been built correctly. Expect it to error out because no configuration options have been passed.
$ src/openocd.exeGDB
GDB is also an essential part of the debugging process but should have been installed alongside the ARM GCC compiler when you got the main build running.
Testing these from the command line
From a command prompt in the OpenOCD folder, run
src/openocd.exe -f interface/cmsis-dap.cfg -c "adapter speed 5000" -f target/rp2040.cfg -s tcland you should see a display similar to the one below.
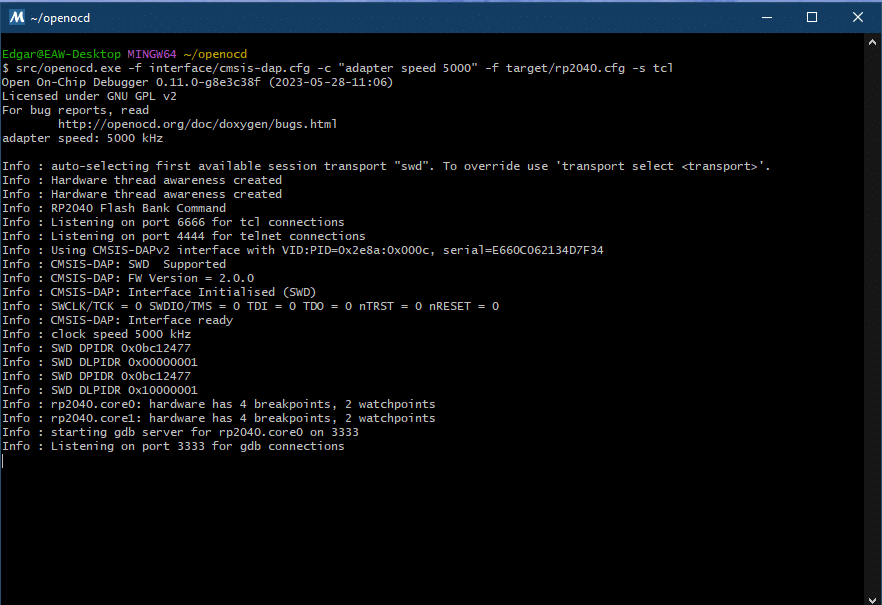
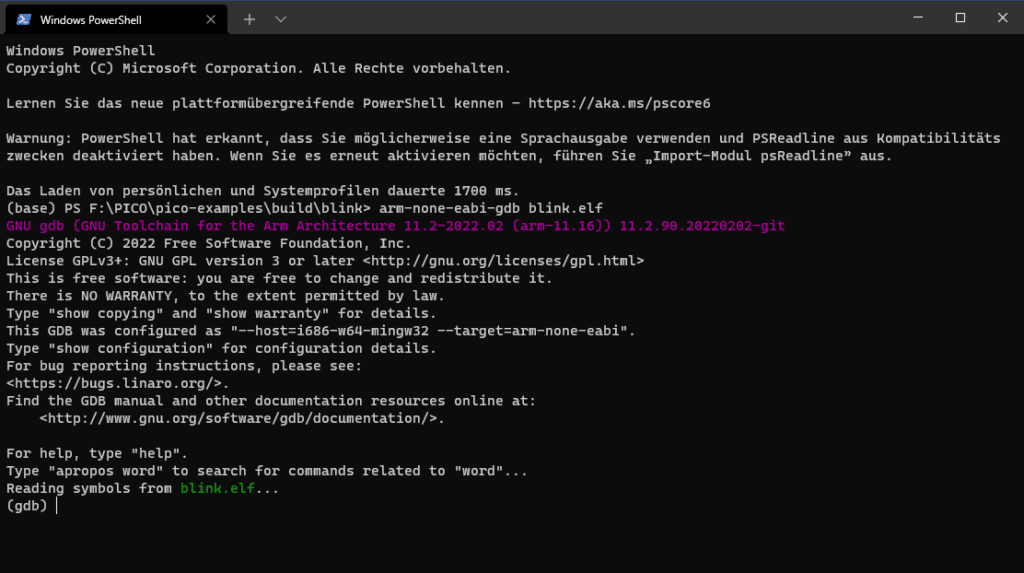
If you get this, then OpenOCD is OK. Leave this running, and from another prompt, open a folder where a known good elf file is. I chose the blink demo from pico-examples/build/blink, so mine is blink.elf and run
arm-none-eabi-gdb blink.elfto start gdb. To get the arm-none-eabi-gbd command running, you need to install Python 2.7.6 from here. You should get something similar to the next image.
You can proceed with the following commands at the (gdb) prompt to load and run your code
target remote localhost:3333
load
monitor reset init
continue
This has proven that we have OpenOCD and gdb set up properly. Whilst we could debug our code this way, it’s much nicer to let Visual Studio Code manage things for us.
Setting up Visual Studio Code for debugging your Pico
Now that we can debug let’s debug in style. Open up a project that you know compiles and runs. We’ll now configure OpenOCD and gdb within VS Code.
Installing extensions
You may already have some of these extensions – depending on what guide you followed – but make sure that the marus25.cortex-debug, cmake-tools, and Cpp-tools are installed. These can be done from the command line as follows:
code --install-extension marus25.cortex-debug
code --install-extension ms-vscode.cmake-tools
code --install-extension ms-vscode.cpptools
Cortex-Debug configuration
Within VS Code, select File / Preferences / Settings… (or just Ctrl-,). Within the settings page, look for Extensions / Cortex Debug Configuration. Trying to change anything will take you to a JSON file – probably C:/Users/(you)/AppData/Roaming/Code/user/settings.json. You must add the entries for cortex-debug.gdbPath and cortex-debug.openocdPath. You can see mine, but obviously, your folders may differ.
{
    (...),
    "cmake.configureEnvironment": {
        "PICO_SDK_PATH": "F:\\PICO\\pico-sdk"
    },
    "cmake.generator": "NMake Makefiles",
    "cmake.configureOnOpen": true,
    "cortex-debug.gdbPath": "arm-none-eabi-gdb",
    "cortex-debug.openocdPath": "F:/PICO/openocd/src/openocd.exe",

}
launch.json
The important settings in launch.json are the configFiles, openOCDLaunchCommands, and searchDir parameters, which you may recognize as the parameters passed to OpenOCD when we run it from the command line. I also found that the svdFile entry needed to be a relative path and did not like starting with a drive letter. This didn’t seem to affect debugging, though.
{
  "version": "0.2.0",
  "configurations": [
    {
      "name": "Cortex Debug",
      "cwd": "${workspaceRoot}",
      "executable": "${command:cmake.launchTargetPath}",
      "request": "launch",
      "type": "cortex-debug",
      "servertype": "openocd",
      "gdbPath": "arm-none-eabi-gdb",
      "openOCDLaunchCommands": ["adapter speed 5000"],
      "device": "RP2040",
      "configFiles": [
        "interface/cmsis-dap.cfg",
        "target/rp2040.cfg"
        ],
        "searchDir": ["F:/PICO/openocd/tcl"],
      "svdFile": "${env:PICO_SDK_PATH}/src/rp2040/hardware_regs/rp2040.svd",
      "runToEntryPoint": "main",
      // Give restart the same functionality as runToEntryPoint - main
      "postRestartCommands": [
          "break main",
          "continue"
      ]
    }
  ]
}
settings.json
I’m not entirely sure why the recommended settings in the Pico guide hide the build button from the lower toolbar. It seems to be needed – as running a debug session does not automatically rebuild the code. The commented-out lines restore this.
{
    "cmake.statusbar.advanced": {
        "debug": {
            "visibility": "hidden"
        },
        "launch": {
            "visibility": "hidden"
        },
        //"build": {
        //    "visibility": "hidden"
        //},
        //"buildTarget": {
        //    "visibility": "hidden"
        //}
    },
    "cmake.buildBeforeRun": true,
    "C_Cpp.default.configurationProvider": "ms-vscode.cmake-tools"
}
Debugging your Pico
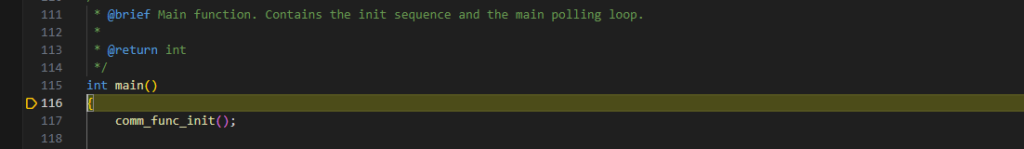
Now, you just need to hit Ctrl-Shift-D (or select the debug tab on the left-hand side) and click on the green arrow next to Cortex Debug. gdb and OpenOCD will deploy your code to the Pico, and you should hit an automatic breakpoint on the first line of main().
References
- Debugging the Raspberry Pi Pico on Windows 10 – Blog – Raspberry Pi – element14 Community
- How to Build OpenOCD and Picotool for the Raspberry Pi Pico on Windows – Shawn Hymel
- visual studio code – GDB Disconnects when trying to debug via openocd – Stack Overflow
- Creating a PicoProbe Debug Probe (visualmicro.com)
0 Comments